Applying Metcalfe’s Law to a Valuation of the Urbit Network

Preface
The article was written by the author as a personal research project while taking a deep dive into the Urbit ecosystem in 2022. As the work on this article was done mostly between July and October 2022, the data is not up to date anymore. We decided to still publish this article to provide insight into the work individual team members do on a regular basis to stay up to date on industry trends and new technology relating to the crypto industry. We use such work to identify potential inflection points around new technology, which provides the opportunity to get engaged as a fund at the earliest stages.
Introduction
Urbit is a peer-to-peer networked operating system (OS) poised to become a significant infrastructure layer for crypto. In order to operate one of the main nodes of the network, users must own the corresponding NFT. The network is live and usable with the focus currently being on onboarding developers and improving the user experience. Right now, the network has around 3,600 active users, grows rapidly, and might be at an inflection point. Based on comparisons with the internet and real estate, the potential network valuation of a mature Urbit could be $11.6tn. This article utilizes Metcalfe’s Law to derive a potential path for Urbit’s adoption cycle and network valuation.
Prelude on the Value of Urbit
On the landing page of urbit.org, Urbit is simply described as “A clean-slate OS and network for the 21st century.” Since the project is still in a relatively early stage, it is difficult to pinpoint what Urbit is and what mass adoption will look like. Genuinely new and highly complicated innovations such as Urbit cannot be accurately compared to existing things, as faulty comparisons and weak analogies miss important nuances and fail to capture the novel characteristics of the innovation itself. The imperfect theses derived from this exercise often lead to an underestimation of the ultimate influence. To a degree, I will be making the same mistake in the next section by comparing Urbit to Facebook and the internet itself. Even though those analogies and comparisons may be faulty, they can still be helpful for understanding a concept in its infancy and provide context for thinking about it. In the next section, I will use two such theses to expand on the claim from urbit.org’s landing page.
The first thesis is that Urbit is a decentralized networked operating system1. This can be likened to the formerly open platforms offered by Twitter, which had open APIs for people to build applications on, and Facebook, where users could develop applications without excessive DevOps overhead (database, storage, login credentials, network communication, etc.) and distribute them directly to users via Facebook servers. Urbit has essentially the same distribution model, just operating in a decentralized fashion. Applications on Urbit are not run on centralized servers, as was the case with Facebook, because the code runs on the decentralized personal server of every Urbit user and exchanges information via Urbit’s peer-to-peer network. In addition, due to the architecture of the network and every personal server running code locally, Urbit applications are highly composable. This means applications can access data from other applications and build on each other, as all data is stored locally on a user's personal server instead of being siloed away on centralized corporate servers. Urbit is to servers what the personal computer was to mainframe computers. Another simple analogy to something that exists today is Wechat, but decentralized and controlled by the user.
The second thesis is that Urbit can act as an infrastructure layer for Crypto, which is highly important to preserve the decentralization of crypto in the long run and not get captured via centralized custodian services. Urbit can prevent this as it becomes a sort of coordination layer for crypto by relegating the complexity inherent in crypto to the background behind a Urbit identity. Specific Urbit apps would handle all relevant actions automatically, and in a decentralized way, as every Urbit identity is a user's own server. These individually owned servers could enable everyone to run their own nodes, which is important for something like Bitcoin Lightning, which can only work with nodes online 24/7. Another example would be a Discord-like chat app with built-in functionality for DAOs such as wallet, voting, multi crypto support, etc. All this can be highly individualized for the needs of a certain group, and would be fully owned and controlled by that respective group. Thus, no banning from Discord, and no need for gluing several different centralized services together. With fixed identities, Urbit apps could automatically detect from which blockchain a transaction is sent, relate it to the correct wallet address and manage and create the whole wallet itself. All of this in the background, without the user needing to know anything about it. The user only has to care about their Urbit identity, while apps handle the rest.
Currently, Urbit is at a point where most of the “hard work” (the kernel, low level and higher level programming language, operating system, p2p network, etc) is running reliably. Now the focus is on increasing the ease of use and making it easier to get onto the network, as it remains somewhat complicated to use. The network is live and usable and has already achieved early product market fit as a chat app, which functions as a kind of MVP and proof of concept product for the network with currently around 3,600 monthly active users. All current Urbit usage is fully organic, as there are no token incentive schemes or even normal marketing efforts by the developing company so far. The focus will now likely shift to bringing developers onto Urbit to build applications with which to attract more users to the network, which again would attract more developers due to the growing user base, starting a flywheel effect. This is expected to be a much faster process than getting the network live, as application development on Urbit is extremely simple compared to web2, a result of reduced devops overhead, apps automatically updating in the background, and generally simplified software distribution.
As opposed to the internet, infrastructure in the Urbit network can be owned by individuals, and is represented by NFTs. Ownable identities in the network exist on several levels and are scarce: There are only 256 Galaxies, ~65k Stars, ~4bn Planets. Planets are meant to be used as personal identities by the user, while Galaxies and Stars could be operated as businesses similar to real estate in the real world. This means providing services to the Urbit network. This would make such assets highly valuable in case of mass adoption as it is comparable to owning a piece of internet infrastructure.
It is important to highlight the uniqueness of Urbit. There is currently no other technology that comes even close to what Urbit has achieved. Given that serious development on Urbit started in 2013, and it took until 2018 to get the network going and until now to make it usable, it is highly unlikely that a competing technology will become usable in the near to mid-term, making Urbit’s moat highly defensible, and thus valuable, in the event of mass adoption. It also shows the inherent complexity of actually developing a technology like Urbit and getting it to work. Building a new operating system and making it work is not easy.
Comparing Urbit Growth Rates to the Internet and Facebook
Complex technology projects take their time from ideation until mass adoption. The table below compares the dates of certain key events in the history of the Internet and Urbit in order to put Urbit’s current state into perspective.
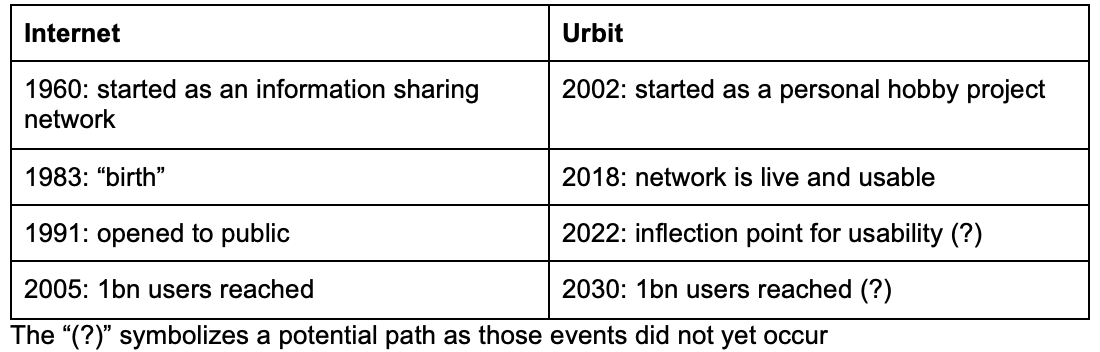
The internet started in the 1960s as a way for government researchers to share information, while Urbit started as a personal side project in 2002. The birth of the internet was in 1983, in which a standardized communication protocol, namely TCP/ IP, was agreed upon. This might be comparable with the Urbit network being live and stable around 2018. The internet opened to the public only in 1991, which could be compared with Urbit’s potential inflection point right now of increased ease of use and the expected influx of developers and users. The internet reached 1bn users for the first time in 2005, and the Metcalfe model outlined later in this article shows a potential path for Urbit to reach this milestone in 2030.
The remainder of this section compares the growth rates and adoption cycles of the internet and Facebook with those of Urbit. An overview of respective user statistics can be seen in the table below.
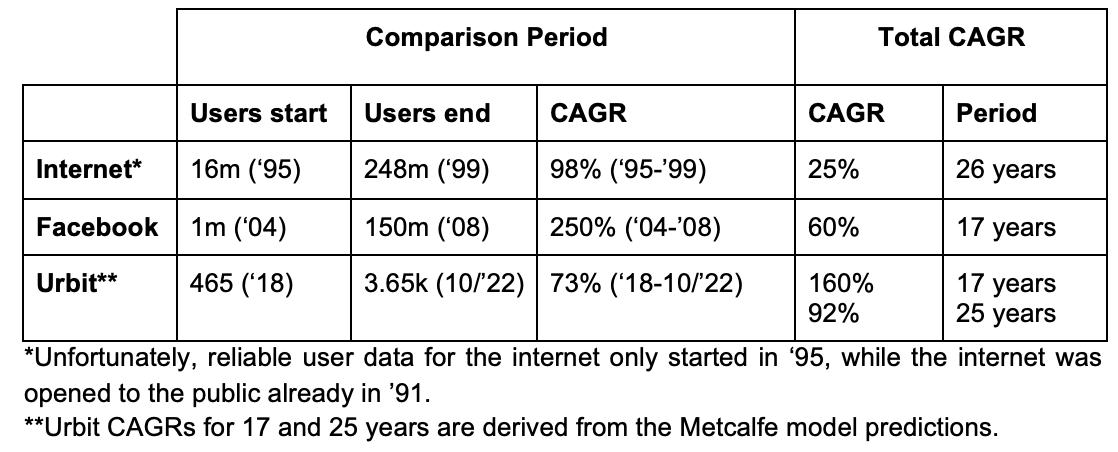
The period in the table is set at 4 years to include the “hot phase” of the internet bubble, which lasted until ‘99 before the burst in March 2000. Since this article assumes Urbit to be at an inflection point right now, with its high growth phase about to start, it is useful to compare it with the growth rates for a similar period. Additionally, Urbit user data has been available since 2018, which provides a relatively comparable 3.5 years of history. In the period from 1995 until 1999 the internet user base grew at a CAGR of 98%, from 16m to 248m. Even though it started from a significantly higher absolute number than where Urbit currently is, the comparison provides useful guidance in line with the assumption of Urbit being at an inflection point, where its Netscape moment is close. Due to the higher absolute user number for the internet, this figure can be used as a lower bound for the growth rate of Urbit’s user base over the next few years.
On the other hand, the Facebook user base grew at a CAGR of 250% from 1m in 2004 to 150m in 2008. Urbit has been growing at a significantly lower CAGR than this at 73% over the last 3.5 years. This can be explained by Urbit being more complicated than Facebook. From 2018 until mid 2020 there was not much to do on Urbit, and the network was mainly reachable via command line tools. Basic tools such as chats, groups, and notebooks have been available since mid 2020 whereas more complicated applications built by users have only started to exist since late 2021, although growing at an ever faster pace.
Applications need to be built on the Urbit network for utility to exist, while Facebook has been ready from day one with respect to its core utility of staying in touch with friends and their lives. As a result, it makes sense that Urbit is growing slower than Facebook in the beginning. At some point this could change as the growing number of applications within the network is likely to start a flywheel effect: applications bring users onto the network, which incentivizes more developers to build applications for the now larger user base, which again brings in more users, and so on. Urbit is an open network that isn’t gatekept by a single centralized company; instead, anybody can build applications on Urbit, which enables the network to grow in multiple directions simultaneously. This opens it to multiple user groups and applications at the same time, with the market automatically picking the most promising ones by vote of user adoption. As a result, the 250% CAGR seems to be a logical upper bound for the Urbit user base growth rate. The flywheel effect of being an open network might be an argument for why Urbit can sustain a higher growth rate longer than Facebook, which saw a decline in growth after the initial 4 years, or that the CAGR of Urbit growth might even exceed the 250% achieved by Facebook.
An additional argument for a higher growth rate of Urbit could be the trend of technology adoption cycles continuously increasing in a ever more connected and globalized world. This is outlined in more detail in this article.
Urbit’s MAU figure as of September 16, 2022 was 2,676 and grew by 36% in only 21 days to 3,650 as of October 7, 2022. This further might be an early indicator in line with the above flywheel argument, but could also be influenced by an influx of users from the Urbit Assembly conference, which was held in between those 2 dates.
A caveat when comparing the above numbers is that Urbit numbers are still very low in absolute terms, thus the value of comparing the growth rates has to be taken with a grain of salt. As outlined earlier, this article assumes Urbit to be at an inflection point right now, but it remains to be seen how that prediction plays out. If it turns out to be correct, these metrics should be a good reference point for user growth going forward and a good way to track whether the thesis actually plays out.
Real Estate Analogy
This section focuses on a potential mature state valuation for the Urbit network, producing several assumptions to be used in the Metcalfe model. This approach is necessary since due to the early stage of the network, there is not enough historic data to fit a reliable model. The Facebook/Tencent paper and Metcalfe himself used 10 years of existing Facebook data to fit their model [6, 7].
Since Urbit galaxies and stars are analogous to real estate, a speculative comparison with the value of all global real estate will be used to derive a potential mature state valuation. As explained in the prelude on the value of Urbit, the network is valuable because it is property akin to land that can be used productively in a way only possible via Urbit, meaning that businesses for products and services can create cash flow within it.
In order to run a business in the physical world, one needs real estate for offices, factories, etc. The combined annual revenue of those businesses worldwide, the GDP, does not simply equate to the value of all real estate. This relationship is instead described by the real estate/ GDP ratio. This article speculatively assumes that in an Urbit world this ratio will be relevant as well, because one has to own infrastructure in the form of stars as a basis to build a business servicing the network in the same way one needs real estate in the real world. That's why this article applies the real estate/ GDP ratio to Urbit for deriving a potential mature state valuation.
To expand on the comparison of Urbit and real estate, there are several instances of existing Urbit materials relating to this analogy such as Galen hinting at it here: "In the long term, the real value of an infrastructure node (a star or galaxy) is not simply in trading on the unit price of planets, but in developing and improving the real estate." Or here, where Urbit is described as "digital land" around minute 2:20. This video outlines this narrative as well. I find this simple analogy of Urbit as digital real estate quite compelling, as it is easy to grasp and makes a key component of Urbit easily understandable, which is ownership and control. Due to this ownership and control users can fully individualize their Urbit according to their own preferences. The analogy is not a perfect fit and works more like a conceptual analogy similar to the “faulty but helpful analogies” outlined in the beginning of this article. In that sense the analogy is comparable to the simple narrative of Bitcoin being described as digital gold even though Bitcoin is much more than that.
As outlined above, the approach is based on the global real estate to GDP ratio. By multiplying this ratio with a proxy for the internet GDP, an implied Urbit valuation can be derived. This assumes the ratio of real estate to GDP for Urbit will be similar to the real estate/GDP ratio in the real world. The internet GDP is used as a proxy for a potential future Urbit GDP, which assumes that if successful, most of the current internet activity will run through Urbit. The result can be used as a reference to a mature state valuation for the Metcalfe model once mass adoption is reached, to a similar extent as today’s internet. Following the above approach, a potential mature state valuation for Urbit of approximately $11.6tn is reached. The table below shows the exact values used in the calculation of this analogy.
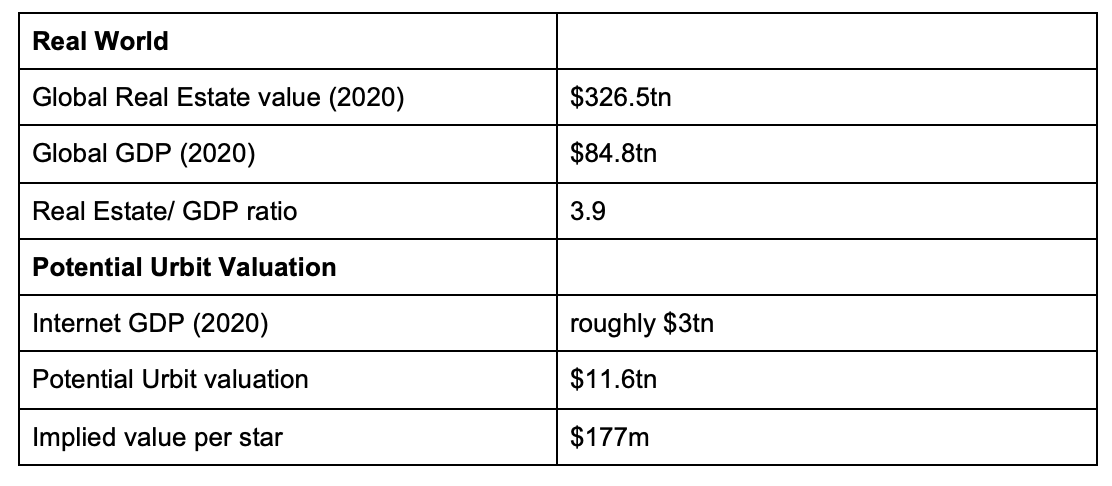
The value for the internet GDP is an approximation, as the actual value reported in the study is $2.45tn, but only measures the value the internet is contributing to US GDP. In order to arrive at the implied impact on global GDP, one could derive this via the US GDP share of global GDP. However, this would assume that the value from the internet is equally distributed throughout the world, which is likely not the case and it is also likely that a disproportionate part would be ascribed to the US as many of the biggest internet companies are US-based. Due to this, as well as for the sake of simplicity, this article uses roughly $3tn as value which is likely to be an understatement.
Metcalfe’s Law Model
This section describes the approach used to create a potential scenario for Urbit’s network valuation based on Metcalfe’s Law. The Model can be found here.
Approach
Metcalfe's Law has historically been one of the most reliable tools to value networks as shown in the case of Facebook, Tencent, or Bitcoin [6, 7, 8]. This article takes inspiration from papers on those networks as well as Bob Metcalfe’s own paper in order to apply a similar model to the Urbit network with the goal of deriving a potential path on how its network valuation might evolve. The approach in these papers is to fit actual data to a model based on Metcalfe’s law. As Urbit is still at an early stage and there is not sufficient actual data to follow this approach, this article will make certain assumptions to derive a potential valuation path. The analogy with real estate stated earlier in the article was done to derive a plausible scenario for a mature state network valuation. The model is then fitted to reach this valuation over a certain time period. This time period and the related growth rates were compared to early Facebook and internet data as a plausibility check.
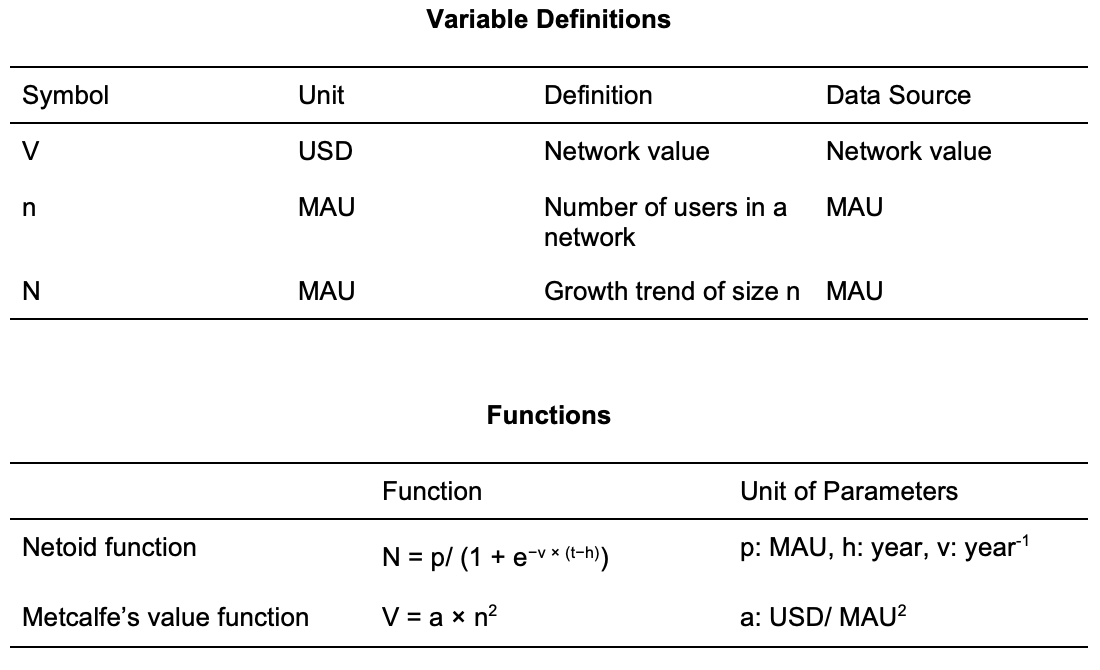
Metcalfe's Law is applied in two steps. First the number of users is predicted via a function created by Bob Metcalfe called netoid function, which is a generalization of the sigmoid function that generates a graph similar to the typical technology adoption s-curve [6]. The second step is to derive the network valuation from the result of the user prediction via Metcalfe’s value function, which multiplies a proportionality factor (a) with the square of the user base size [6].
Methodology and Critical Assumptions
As mentioned earlier, the Urbit network has different levels of scarce identities: planets, stars, and galaxies. This model will use stars for valuation, meaning the actual network valuation for 2018 until 2021 will be derived via star prices at year end, or the average price in December of the respective year depending on data availability. Stars have been chosen as they are the most actively traded asset of the three options. In addition, most individual investors seeking financial exposure to Urbit buy stars, so they provide the best reflection of network value overall. Planets are too cheap, usually around $10 - $25, have been for a long time less expensive than gas fees for the buying transaction on NFT marketplaces, and are often given away for free. In addition, the key motivation to buy a planet is to get access to the network, not to get financial exposure to Urbit. Lastly, galaxies, which are the most valuable of the options, and often trade above $1m; do not trade very frequently and are thus less reliable for network valuation than stars.
The Facebook/Tencent paper used monthly active users (MAUs) as a proxy for its active user base [7]. Due to the relative infancy of Urbit there is no historic MAU record available. As a result, this article uses “network keys set” (NKS)2 as a proxy for the active Urbit user base in 2018. The MAU figure for 2022 is based on a network metric collected by the main Urbit development company, defined as “ships that have responded to pings from the ~zod galaxy, which is used for software updates, in the past 30 days”. The MAU figures for 2019, 2020, 2021 have been derived implicitly from the 2018 - 2022 CAGR. MAU figures from 2023 onwards are forecasted via the Metcalfe Model.
As previously outlined during the comparison of Urbit to similar past innovations, the growth rate and adoption cycle of Urbit can be convincingly mapped onto that of Facebook. This predicts the end of the s-curve adoption period at 25 years with the majority of adoption achieved in about 15 years. A timeline faster than Facebook (17 years) and the internet (26 years) can be justified by the previously discussed open network effects, as well as Urbit's ability to build on existing internet infrastructure. Additionally, the assumption of a strong s-curve adoption is justified by the result from fitting the prediction to actual growth numbers, starting from 2018.
Another assumption is that the network is currently at an inflection point, meaning a strong increase in adoption over the coming years is expected. This is based on the “hard part” of Urbit development, which is creating a live network that is working reliably, being largely completed. With this stability achieved, the focus turns to acquiring developers for building apps, which is expected to lead to an influx of users. A core tenet of Urbit is that development on Urbit is much easier than web2, since there are fewer devops requirements due to Urbit’s architecture as a network of personal servers, enabling software distribution of Urbit apps and running those locally on one's own server, as outlined in the prelude.
Netoid Function
The model predicts the Urbit user base growth via the netoid function, a generalized sigmoid function created and named by Bob Metcalfe. He used the function to fit the actual data of Facebook to Metcalfe’s law in order to prove the law’s validity [6]. The Facebook/Tencent paper has used the same function and validated earlier results from Bob Metcalfe [7]. This article uses the netoid function to predict the Urbit user base size. The function essentially creates the typical s-curve often seen in adoption of new technology or startup growth. This process typically starts with a phase of slow growth in the beginning, followed by a phase of rapid exponential growth during which mainstream adoption is reached, followed by another phase of slow growth where the network reaches its maturation phase. The netoid function relies on 4 input variables, h, v, p, t, which have the following meaning:
- h: max adoption rate
- v: speed of adoption
- p: peak adopting population
- t: year for which the user base size is predicted
Metcalfe himself “fiddled” with the above assumption values until he achieved a good visual fit [6]. The Facebook/ Tencent paper which confirmed Metcalfe's paper used a more scientific approach to deriving the variables, namely the least squares method in curve fitting [7]. This article uses fixed assumptions for the variables (h) and (p), and derives the variable (v) by fitting the user base prediction to actual growth numbers via fiddling with the value similar to Metcalfe. The following section will explain how these assumptions were made with the exception of variable (t), which is self-explanatory.
Max Adoption Rate (h)
The max adoption rate is assumed to be 2030.5, which is derived from the assumption that it will take 25 years from the point of the network being live (2018) until a mature state is reached. This has been derived via the comparison with how long the Internet as well as Facebook have taken to reach similar states. A key assumption of the netoid function is that the network's growth rate peaks at half of its adoption time [7], giving 12.5 years which leads to 2030.5 as the timing. The model has the highest growth rates in the years 2029/2030.
Speed of Adoption (v)
The speed of adoption, i.e. the skewness of the s-curve, is assumed to be 1.3. This value assumes a slow absolute adoption growth in the beginning, followed by a strong increase once the inflection point is reached. This is assumed to happen during the coming years following the earlier assumption of Urbit being at an inflection point. Finally, a period of slow growth is again assumed for the mature state once mass adoption is reached. The value has been derived by fiddling with it in order to have the result from the function be in line with the actual growth and current state of the Urbit user base.
Peak Adopting Population (p)
The peak adopting population, which is defined as the size of the adopting population once the mature state is reached, is assumed to be 5bn, which is around where current internet adoption is. This assumes that ultimately Urbit will reach the same number of users as the internet has right now.
Value Function
The second part of deriving a network valuation is to use the previously calculated user base prediction and calculate the network valuation from it via Metcalfe’s value function, which multiplies the square of the user base with a proportionality factor (a). A higher proportionality factor equates to a higher value per user. Metcalfe stated that the factor can decrease over time due to Dunbar’s law, upon which the incremental value of every additional user decreases over time [6]. Dunbar’s law sets the barrier beyond which humans cannot have meaningful relationships sustainably at 150 connections. However, he also stated that the value per user could increase over time and named Ethernet networks, which he invented and launched, as a counterexample where the value per user actually increased over time [5]. The Facebook/Tencent paper assumed this value to be constant over time [7]. Thus there is no consensus as to how the value should change over time. While both the Facebook/Tencent paper and Metcalfe’s 2013 article used the function to derive the revenue, this article uses the function to derive the network valuation directly.
The proportionality factor is used to fit the model to the actual data. For the Urbit model, the first years from 2018 until 2021 have been used to derive the proportionality factor from the actual network valuation. Specifically, the proportionality factor for those years is derived by restating Metcalfe’s value function to solve for the proportionality factor from the actual network valuation and the modeled prediction. From 2022 onwards, where no network valuation data exists, an assumption is made to have the proportionality factor change over time: -80% per year based on the strong decrease of the factor of >-80% in the years where data exists. This might seem odd at first, but can be explained with crypto specific reasoning. Typically, crypto projects price in optionality and future utility early on, likely resulting from the significant returns from early Bitcoin or Ethereum investments. Ethereum peaked at a $140bn market cap in the last cycle with 2.3m weekly users at the time [9]. Uniswap peaked at a $22.5bn market cap in May 2021 with 1.7m total users [9]. And Solana peaked in November 2021 at $77bn with close to 1m daily users [9]. Facebook, on the other hand, reached a $65bn market capitalization with 1bn MAUs [2], which shows a higher value per user of crypto networks relative to more traditional startups. It is assumed that pricing in future value at such a steep premium will stop once mass adoption is in the process of being reached, which happens towards the mid or end of the exponential growth phase during the s-curve adoption. As a result, the annual change of the proportionality factor will quickly trend from -80% to 0 from 2030, which is the peak in terms of adoption speed, until 2034. From 2035 onwards, the network valuation will be mostly based on actual fundamentals and not on potential future utility. This is why the proportionality factor will remain constant from 2035 onwards, implying the value per user to remain constant as well.
Results
The model results show a potential path of how the Urbit user base as well as network valuation could evolve over time. The curves appear similar as the network valuation is being derived from the size of the user base in a proportional way. Below are the graphs for the user growth.
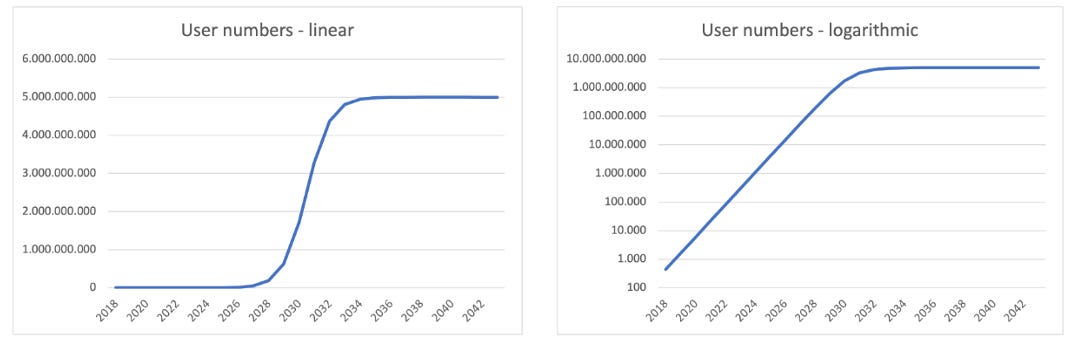
As is visible in the linear graph on the left, user numbers follow the typical s-curve cycle. Exponential growth can be better visualized via logarithmic charts, as depicted on the right side. This clearly shows the exponential growth, which starts decreasing once approximately half of the total population adopts Urbit by around 2030. The user numbers are based solely on the model prediction.
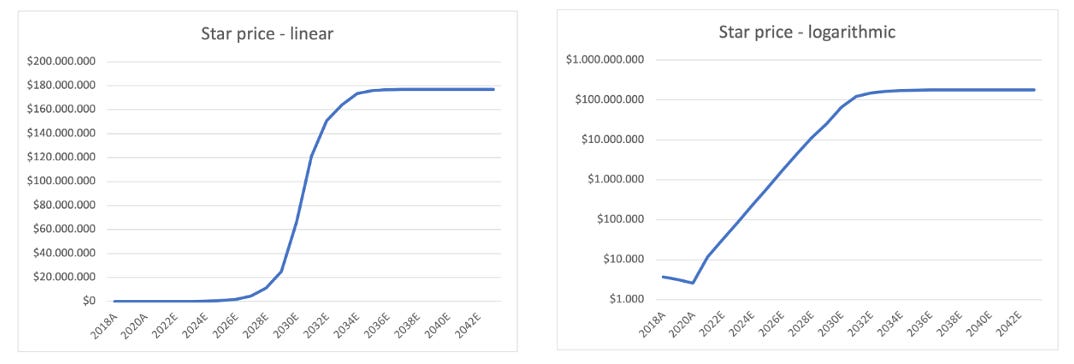
As stars have been used initially to derive the implied network valuation for the period 2018-2021, network valuation is depicted again in the form of star prices. The graphs look similar to the ones on the user numbers, linear growth on the left and logarithmic on the right side. The slight decrease on the logarithmic chart is due to actual valuation data being depicted for the years 2018 - 2021, which includes the crypto bear market from 2018 - 2020 with decreasing valuations across the board including for Urbit. As stated, the network valuation charts depict actual network valuation data from 2018 - 2021, and the model prediction thereafter.
The model outlines a potential network valuation of $4.3tn and an implied star price of $66m with a user base of 1.7bn by 2030. As a mature state valuation, the model outlines $11.6tn and an implied star price of $177m with a user base of 5bn as derived via the real estate analogy outlined earlier in the article.
Caveats
This section outlines certain variables and assumptions the model strongly relies on, which might turn out to be significantly wrong. Due to the relative infancy of Urbit, some significant assumptions are required, as there is no reliable data to fit the model to. The model predictions have to be monitored over time, compared to actual data on how Urbit evolves, then adjusted to fit the real world data. The model will become more accurate over time as it is updated with and fitted to real world data.
- Urbit will likely not eat all categories of current internet activity, e.g. government supported web2 platforms, HFT and data streaming applications reliant on high throughput, which could reduce the opportunity size named in the real estate analogy section. On the other hand, Urbit is likely to enable novel use cases with their own value uniquely enabled by Urbit, and the internet itself is still growing, both of which could enlarge the opportunity size.
- The real estate analogy used to derive a potential mature state network valuation is speculative and might be one of those “faulty but helpful” analogies outlined in the beginning of the article, or even turn out to be completely wrong.
- Urbit is still in a relatively early stage of development, so comparisons with Facebook, Tencent, etc should be seen not as a certainty but as a potential path for the future with significant risks attached to it actually being realized.
- The model is a hypothetical future and real data needs to be applied to it in the future to see whether it holds or not, it depends on a lot of assumptions that cannot yet be tested empirically due to the relative infancy of the network.
- Factors p,v,h are usually fitted to the curve of actual data via a statistical model. As there is no history for Urbit to do this, assumptions have been made. Those can and likely will turn out to be wrong.
- Only the adoption speed v is fitted to the model by fiddling with its value. It needs to be monitored whether the network evolves in line with the prediction or not. My guess would be that mass adoption could take longer than predicted by the model.
- The model result is significantly influenced by the proportionality factor, which has been derived from the relationship between the actual network valuation for the years 2018-2021 and the model user base prediction, and modeled to fit the potential mature state valuation derived from the real estate analogy.
- A caveat for the different levels of address space (planets, stars, galaxies) is that this model is based on stars and the valuation ratio of stars and planets or galaxies might change over time. The implied valuation shown in the model for planets or galaxies assumes a constant relationship, which might turn out to be wrong. In fact, those ratios have already changed over the past years, and researching how those ratios change and what the implications could be would be an interesting follow-up to this article.
Conclusion
Urbit is clearly a powerful and unique technology growing at similar rates to the early internet or Facebook. In other words, it is “happening”. Native assets in the network are similar to real estate, which implies a potential mature state network valuation of $11.6tn based on applying the same real estate/ GDP ratio as in the real world and star prices of potentially $66m by 2030 or $177m at mature state. Most importantly, Urbit is sound computing providing control and ownership to its users, and keeping crypto decentralized by preventing capture from centralized custodial services. You can find more about how to get started on Urbit here.
👇Please also read our disclaimer before taking any decision!
Thanks
Finally, I want to thank everyone who helped during the process of writing this article by facilitating intros, providing network data, or providing feedback on the article. In no particular order, thanks to: ~pindet-timmut, ~simfur-ritwed, ~dinleb-rambep, ~lavlyn-litmeg, ~sarlev-sarsen
Sources
Comparing Urbit Growth Rates to the Internet and Facebook
- internet growth rates
- Facebook growth rates until 2012, after 2013
Real Estate Analogy
Metcalfe’s Law Model
- “Guest Blogger Bob Metcalfe: Metcalfe’s Law Recurses Down the Long Tail of Social Networks.” VC Mike’s Blog, Vol. 18 (August 2006)
- Metcalfe, B. “Metcalfe's Law after 40 Years of Ethernet.” Computer, Vol. 46, No. 12 (2013), pp. 26–31.
- Zhang, X., J. Liu, and Z. Xu. “Tencent and Facebook Data Validate Metcalfe’s Law.” Journal of Computer Science and Technology, Vol. 30, No. 2 (2015), pp. 246–251.
- Peterson, Timothy, Metcalfe's Law as a Model for Bitcoin's Value (January 22, 2018). Alternative Investment Analyst Review, Q2 2018, Vol. 7, No. 2, 9-18.
- price data from Coingecko.com, usage data: Ethereum, Uniswap, Solana
Metcalfe Excel Model
The model itself including further sources can be found here
Disclaimer
To avoid any misinterpretation, nothing in this blog should be considered as an offer to sell or a solicitation of interest to purchase any securities advised by Blockwall, its affiliates or its representatives. Under no circumstances should anything herein be interpreted as fund marketing materials for prospective investors considering an investment in any Blockwall fund. None of the data and information constitutes general or personalized investment advice and only represents the personal opinion of the author. The author and/or Blockwall may directly or indirectly be exposed to the mentioned assets/investments. For further information please view the full Disclaimer by clicking the button below.
This work is licensed under the Creative Commons Attribution – No Derivatives 4.0 International License. CC BY-ND 4.0 Legal Code | Creative Commons